Excerpt from our newsletter:
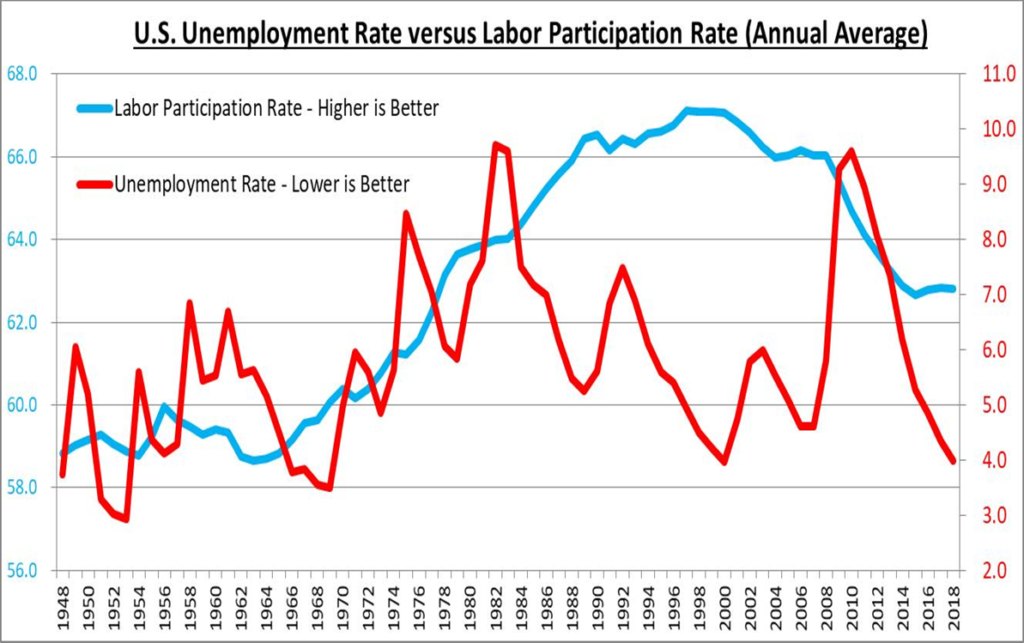
A headline worth pointing out from the 2nd quarter was the official unemployment rate hitting 3.8%, the lowest level in 18 years. It is interesting to note that the last time unemployment hit 3.8% was in April 2000 and lasted only one month. One would have to go all the way back to 1969 to again see a rate of 3.8% or lower, meaning the latest low unemployment rate has only seen one other occurrence in 48 years.
This is rare.

While this may sound like great news for today’s economy, and it is great, there is other data to consider and which tempers some of the excitement. First, wages have only grown at 3% for many years now, which barely keeps pace with inflation. Some would say inflation is running at a much higher rate than what is published, but that is a topic for another newsletter. Another significant factor to consider, the unemployment rate does not take into account people who are no longer looking for work.
One should therefore consider a measure such as the “labor participation rate,” which calculates the number of people employed or looking for work as a percentage of total working age, non-institutionalized people. Labor participation dropped during the financial crisis to levels last seen in the late 1970s and has remained stubbornly around those levels for four years and counting. There are some encouraging signs on wages and labor participation rates, but a strong trend has yet to emerge. The chart above illustrates the unemployment rate (red) and the labor participation rate (blue) since 1948.
